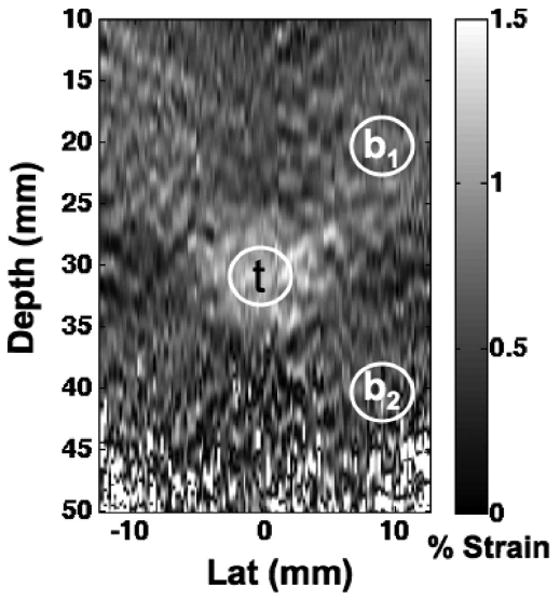
Fig. 2.

Regions of interest used to compute contrast to noise ratio (CNR) from elastograms. The target region, t was used along with a background region that was centered at either 20 mm in depth, b1, or centered at 40 mm in depth, b2. Regions of interest were approximately 5 mm in diameter.
