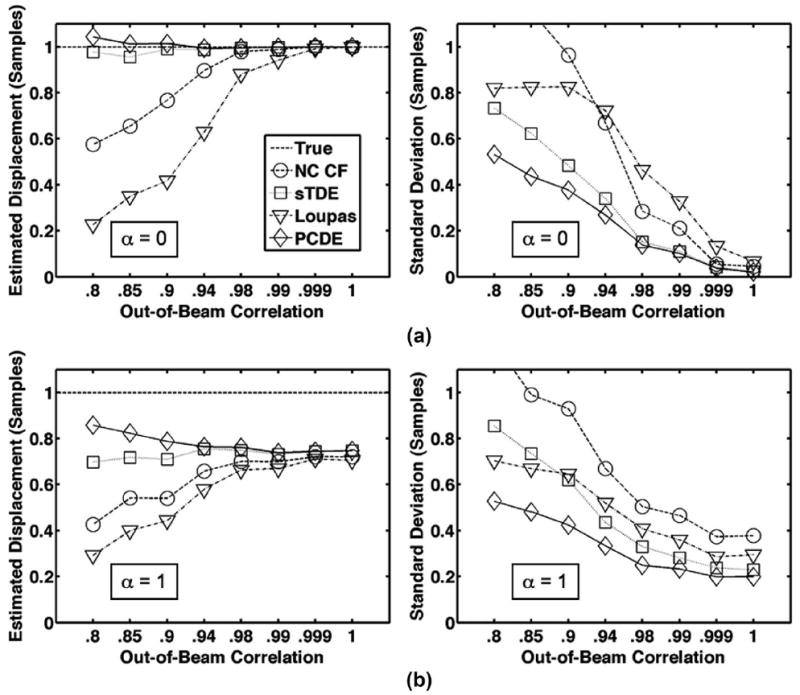
Fig. 4.

Row (a) illustrates average estimated displacement (left) and standard deviation (right) for each estimator over 1000 trials when only out-of-beam decorrelation is simulated and differential motion is not present (α = 0). Resulting echo correlation was varied between 0.8 and 1.0. In row (b), average estimated displacement (left) and standard deviation (right) are illustrated when both out-of-beam decorrelation and differential motion decorrelation are simulated. Differential motion weighting was set according to default parameters in Table I (α = 1). The dashed line is defined as the ‘true’ displacement, which corresponds to the peak displacement in the beam. For illustrative purposes, the x-axis is not a linear scale.
