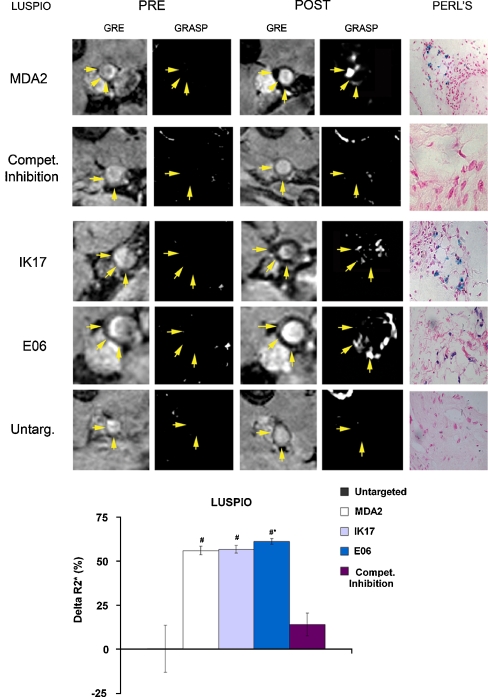
Fig. 10.
Representative in vivo LUSPIO MRIs obtained prior to (pre) and 24 h after administration of a 3.9-mg Fe/Kg dose in apoE−/− mice. The yellow arrows indicate the position of the lumen associated with the abdominal aorta. All GRE images shown were obtained using an echo time of 7 ms. Corresponding white marker GRASP images are also shown. For the competitive inhibition results, apoE−/− mice were administered free excess MDA2 antibody at the time of MDA2-labeled LUSPIO injection. Matched histology sections show iron deposition (blue) within foam cells associated with the arterial wall. Relative percent changes in the R2* values associated with the arterial wall following administration of the LUSPIO formulations are also shown (bottom panel). The error bars reflect the standard deviation associated with mean value obtained for mice receiving untargeted LUSPIOs and n = 6 mice receiving MDA2 or E06-labeled LUSPIOs. (Reprinted with permission from Briley-Saebo et al. [28••])

