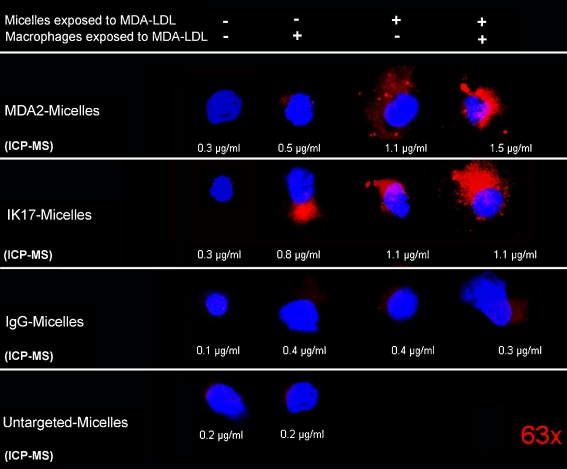
Fig. 8.
Confocal microscopy (63×) showing the association of micelles with macrophages in in vitro experiments. Macrophages and micelles were either exposed (+) or not exposed (–) to MDA-LDL prior to mixing together in cell culture. Red (rhodamine) represents the presence of micelles and blue (DAPI) macrophage nuclei. The numbers under each panel represent gadolinium content measured by inductively coupled plasma mass spectrometry (ICP-MS) normalized to total cell number. (Reprinted with permission from Briley-Saebo et al. [22••])

