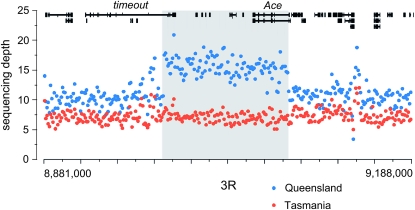
Figure 10.—
A large region of increased copy number in Queensland occurs on chromosome 3R. We plot the average number of sequence reads for each 1-kb window across this region, both for the Queensland (blue) and for the Tasmania (red) populations. Genes in this region are drawn across the top. The gray box indicates the inferred region of increased copy number in Queensland.

