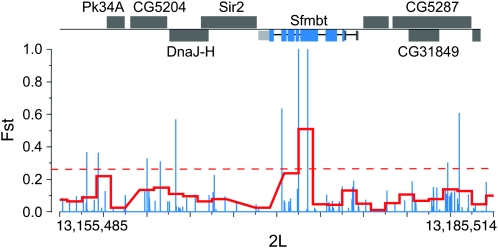
Figure 4.—
Regions of high population differentiation localize within the Sfmbt gene on chromosome 2L. We plot individual-position FST (blue) and mean FST within 1-kb windows (red) across the chromosome. The red dotted line indicates FST cutoff for the top 2.5% of 1-kb windows. Individual genes are drawn across the top (black); exons are in blue, 3′-UTRs in light gray, and 5′-UTRs in dark gray.

