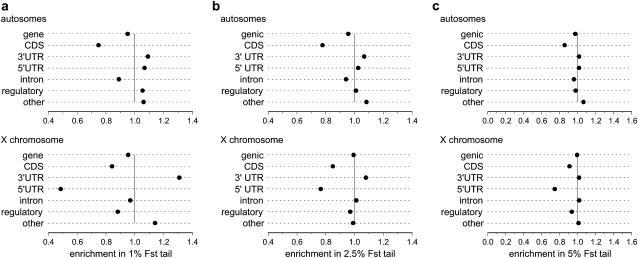
Figure 5.—
3′-UTRs and unannotated regions are overrepresented in the most-differentiated genomic regions. We calculated the enrichment for each annotation type in the 1% (a), 2.5% (b), and 5% (c) tail of 1-kb FST regions, relative to each type's distribution across all 1-kb windows in the normally recombining portion of the genome. Results are shown separately for autosomes and the X chromosome. An enrichment score of 1.0 (indicated by a solid vertical line) indicates no enrichment or depletion; values >1 indicate an overabundance of that type in the FST tail, whereas values <1 indicate underabundance.

