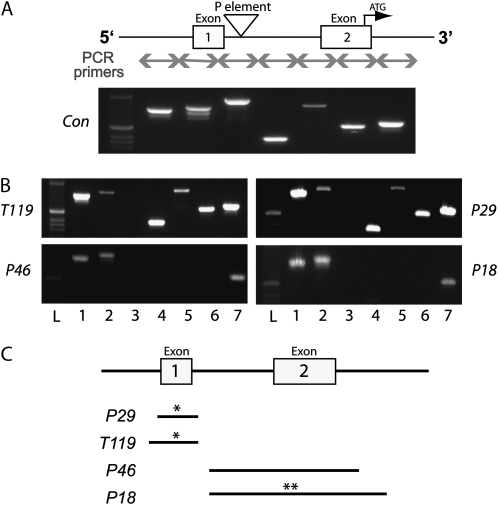
Figure 2.—
Deletion mapping of CASK-β mutants. PCR across the genomic region surrounding the original P-element insertion site was used to map the candidate lines. (A) Schematic shows the genomic region, with arrows denoting the location of primer pairs. Each primer produces a uniquely sized band in wild type. The precise excision line (Con) is shown. Molecular weight marker is shown in the far left lane; the brightest ethidium band corresponds to 506 bp. (B) Deletion maps from the four candidate lines are shown. Loss of a band signifies deletion of the genomic region corresponding to one or both primers. Lines T119 and P29 are missing band 3, which corresponds to the region immediately surrounding the original insertion site. Lines P18 and P46 are missing band 3, as well as downstream bands 4–6. (C) Sequencing confirmed PCR deletion mapping and showed that P29 and T119 harbor deletions of exon 1 (UTR) and a small part of the promoter region. P18 and P46 harbor deletions of exon 2, which consists of both UTR and coding sequence. P29 and T119 both have small insertions elsewhere in the genome (denoted by a single asterisk), while P18 has an additional insertion at the deletion site (denoted by a double asterisk).

