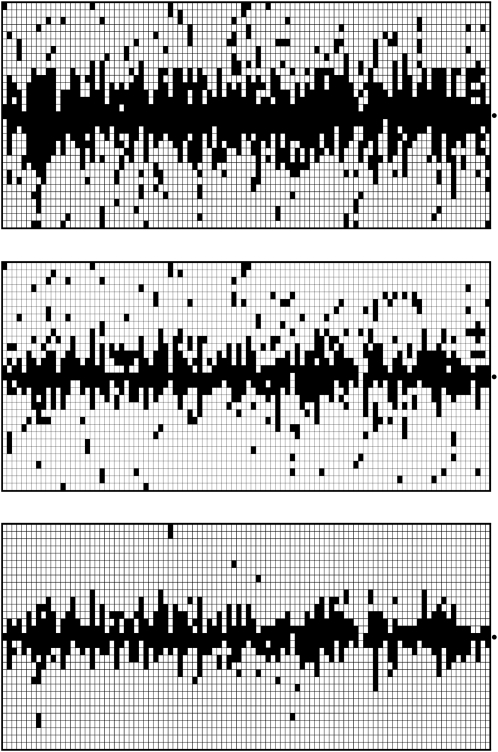
Figure 5.—
Boosting-based genome scans. In each of the three diagrams, each column represents an independently simulated 100-kb chromosome region where a beneficial mutation (α = 500, τ = 0.001) occurred. The rows indicate the position within the sequence. The dot to the right of each graph marks the position 50 kb where the beneficial mutation occurred. Within a column, each pixel indicates the classification result based on a 40-kb window sliding along the chromosome region (step length 2 kb). Training was done with neu + sel(500, 0.001). A solid pixel indicates that boosting predicted the considered position to have experienced a selection event. As desired, the solid pixels are concentrated at the selected position. In the top diagram, six different summary statistics were used, whereas in the middle diagram, only  , Tajima's D, and iHH were used. The type I error probability was adjusted to 5% in both cases. In the bottom diagram, the same six summary statistics were used as in the top diagram, but the type I error probability was reduced to 0.2%, corresponding to a threshold of γ = 0.5 for the boosting classifier. Both using position-specific summary statistics and decreasing the type I error probability lead to decreased false positive rates in a genome scan.

