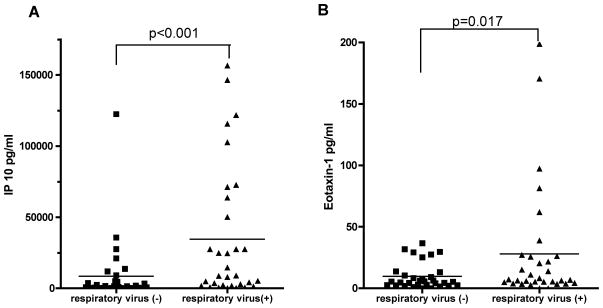
Figure 1. Levels of IP-10 and eotaxin-1 in BAL.
IP-10 (A) and eotaxin-1 (B) concentration in BAL sample in patients with respiratory virus (solid square) and without respiratory virus infection (solid triangle). IP-10 and eotaxin-1 were significantly increased in the respiratory virus-positive group among the 27 inflammatory mediators tested by multiplex flow-cytometry based assay. Horizontal lines indicate the mean levels in each group.

