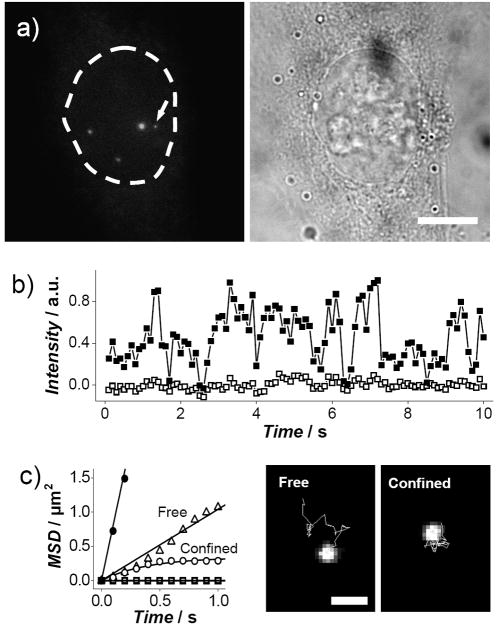
Figure 3.
Delivery and tracking of single QDs inside a nucleus. a) Delivery of QDs into the nucleus of a living HeLa cell: fluorescence image (left, bright spots showing delivered QDs) and the corresponding bright-field images (right) of the cell on a focal plane. The dotted line indicates the boundary of the nucleus. Scale bar, 10 μm. b) Typical time trace of the fluorescence intensity (■) of a slow-moving QD, indicated by the arrow in (a), showing the blinking pattern, plotted with the background signal (□) of neighboring areas. c) MSD versus time data of QDs in the nucleus, showing three types of characteristic motions: free diffusion (△ and ●), confined diffusion (○) and virtually stationary during the observation (□) (left). The solid lines are the fit of free and confined diffusion models.[9, 17] The freely-diffusing QDs in the plot have D values of 0.3 and 2 μm2/s. Tracking of QDs in the nucleus, showing freely diffusing and confined QDs (right). Scale bar, 1 μm.

