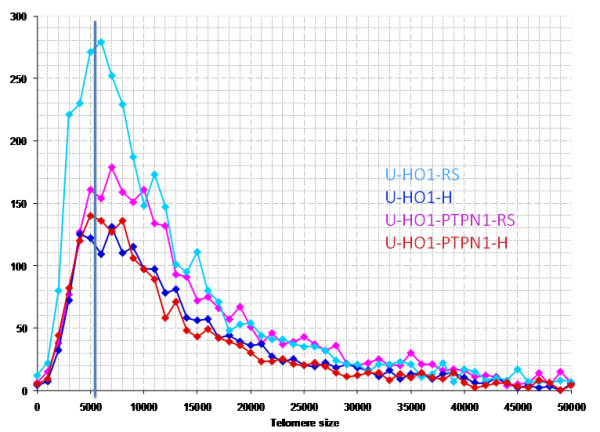
Figure 5.

Telomere distribution according to size in U-HO1 and U-HO1-PTPN1. Results are based on 3D analysis of at least 30 H-cells and at least 30 bi- or multinucleated RS cells. Grey line at 5000 U demarcates the border between very short telomeres including "t-stumps" and short telomeres. U-HO1 RS-cells (clear blue) show significantly more (p < 0.0001) very short telomeres (0-5000 units) compared to U-HO1-PTPN1 RS-cells (pink). U-HO1-PTPN1 RS-cells have nearly identical numbers of very short telomeres as U-HO1-PTPN1 H-cells consistent with the possibility that PTPN1 expression abolished the formation very short telomeres including "t-stumps" during the transition from H- to RS-cells.
