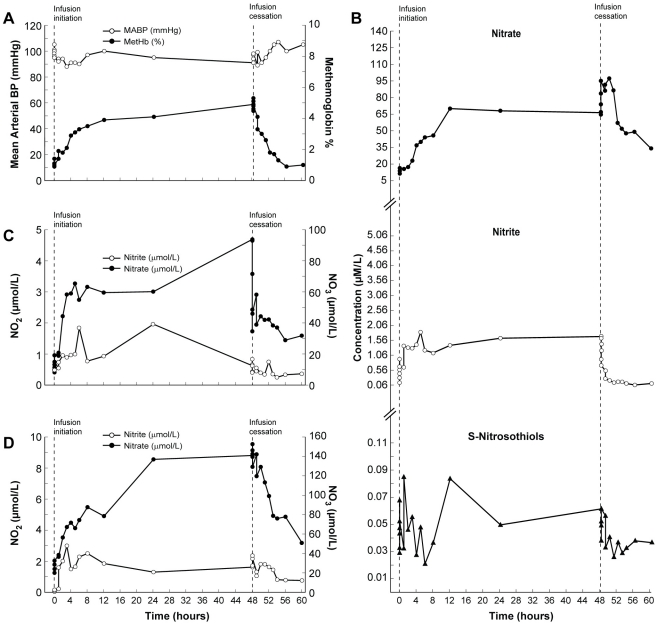
Figure 3. Clinical and biochemical data for Subject 11 (Dose Limiting Toxicity; DLT).
This composite graph depicts: A; mean arterial blood pressure and methemoglobin and NO metabolome concentrations in plasma (B; nitrite, nitrate, S-nitrosothiols), red blood cells (C; nitrite and nitrate) and whole blood (D; nitrite and nitrate) in subject 11 who developed significant methemoglobinemia during sodium nitrite infusion at 445.7 µg/kg/hr. Mean arterial blood pressure remained stable during the infusion. The infusion remained uneventful until 2 and 5 minutes after the infusion cessation when methemoglobin level increased above 5% (A). However, it decreased during the next 5 minutes and returned to baseline at 8 hours after stopping sodium nitrite infusion. The subject remained asymptomatic. Within the NO metabolome only nitrite concentrations in plasma and red blood cells returned to baseline values; plasma nitrate, whole blood nitrite and nitrate, and S-nitrosothiols concentrations in plasma remained higher than the initial values until the end of the observation interval.

