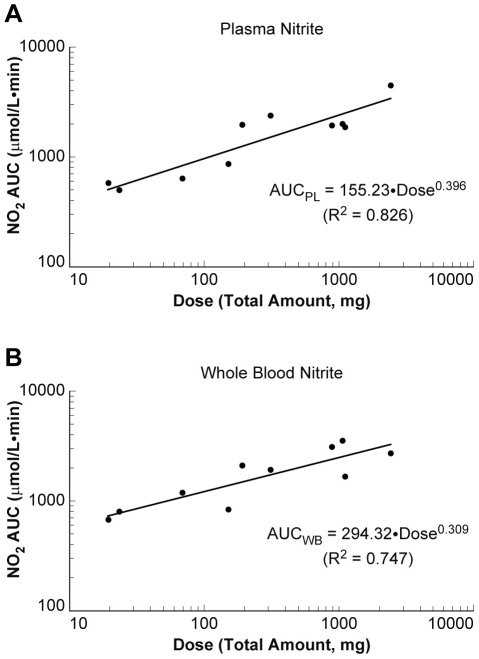
Figure 5. Nitrite pharmacokinetics in plasma and whole blood.
Dose proportionality of nitrite in plasma (left panel) and in whole blood (right panel) was assessed using the area under the concentration-time curves AUC0-last as a function of dose in milligrams. The estimated power coefficient (β1) for plasma and whole blood nitrite was significantly less than 1, indicating nonlinear pharmacokinetics of nitrite. This nonlinearity could be attributed to the increased nitrite clearance at the higher dose compared with the lowest dose, which strongly suggests that nitrite is much more rapidly removed from the body at higher doses.

