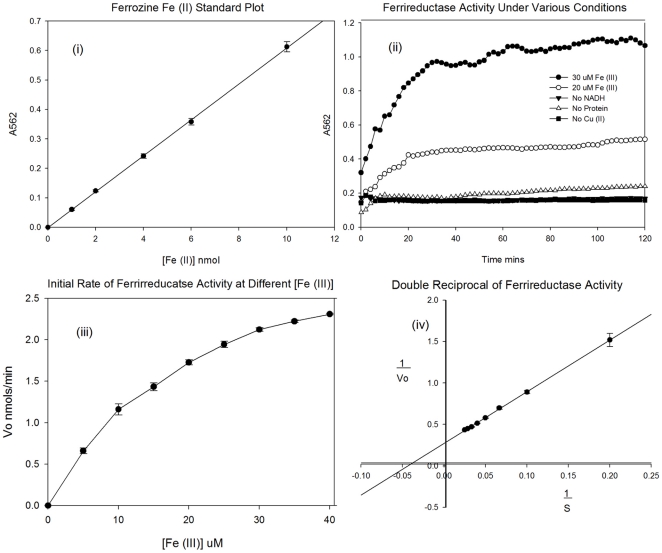
Figure 2. Kinetic plots of the ferrireductase activity of αS at 25°C.
(i) Ferrozine calibration curve for standards of Fe (II) sulphate monitored at 562 nm. (ii) The change in absorbance for formation of ferrozine – Fe (II) complex at 562 nm for αS with either 20 mM or 30 mM Fe (III) and controls missing either protein, copper or NADH. (iii) Initial rates of activity dependent on substrate concentration. (iv) Double reciprocal plot for the calculation of Vmax and Km.

