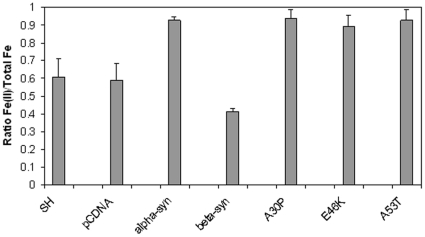
Figure 5. Iron Content of Cells.
The levels of Fe(II) as compared to total cellular Fe (Fe(II)+Fe(III) in cell lines were assessed using a commercial assay. The cell lines were stably tranfected with either pCDNA, αS, the three αS mutants or βS. As a control the parental SH-SY5Y (SH) cell line was also analysed. Shown are the mean and standard error for three individual experiments with triplicate analyses.

