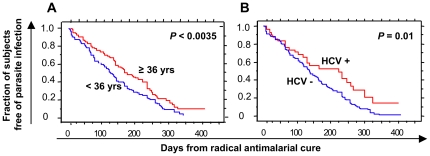
Figure 4. Kaplan-Meier Survival Curves for the Patients According to (A) Age or (B) Hepatitis C Virus serostatus.
(A) in blue fraction of patients ≤36 years old free of infection, in red patients ≥36 years old free of infection. (B) in blue fraction of patient HCV negatives free of infection, in red fraction of patient HCV positive free of infection.

