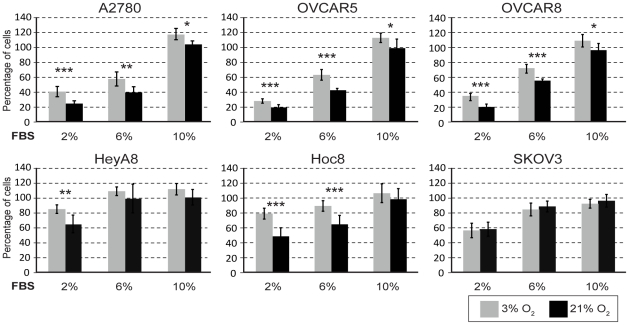
Figure 2. Ovarian cancer cells grown under physiological and ambient O2 show differential proliferation response.
Ovarian cancer cell lines were cultured under 3% or 21% O2 and the extent of proliferation was determined following 3 days of growth (see Materials and Methods section). For each cell line, the percent of cell proliferation at 3% O2 (light shaded bars) and at different concentrations of serum was compared with proliferation under standard tissue culture conditions consisting of 21% (ambient) O2 (dark shaded bars) and 10% FBS. The error bars represent the standard deviations of mean and statistical significant (by student T Test) differences in proliferation between 3% and 21% O2 for each concentration of serum is indicated by an asterisk [(*) p<0.05, (**) p<0.001 and (***) p<0.0001].

