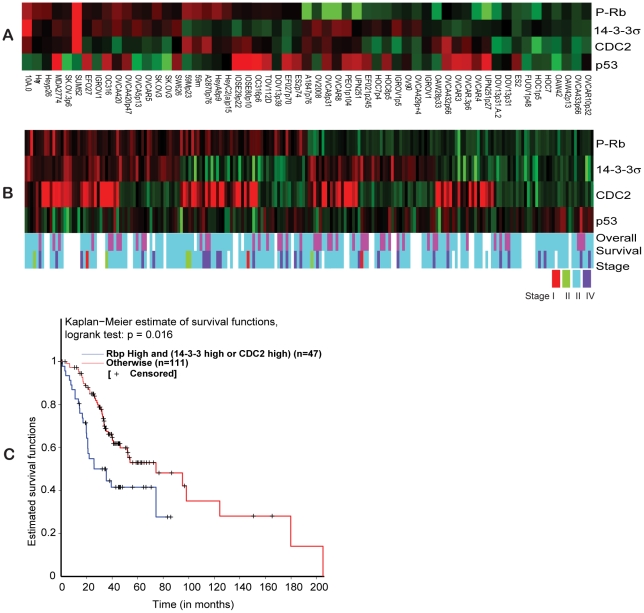
Figure 6. Reverse phase protein array data analysis.
(A) Hierarchical clustering of normalized RPPA data over Phospho-RB (Ser 807/811), 14-3-3 σ, CDC2 and p53 across 57 ovarian cancer cell lines. (B) Hierarchical clustering of normalized RPPA data over Phospho-RB (Ser 807/811), 14-3-3 σ, CDC2 and p53 across 205 ovarian tumors. The color codes for overall survival represents overall survival >24 months (blue) and overall survival <24 months (pink). The color codes for tumor stage represent stage I (red), stage II (green), stage III (light-blue) and stage IV (dark-blue). (C). Kaplan-Meier survival curve for the RPPA results comparing the group of ovarian tumors with high Phospho-RB and high 14-3-3 σ or CDC2 (blue line) with other expression profiles (red line).

