Figure 1.

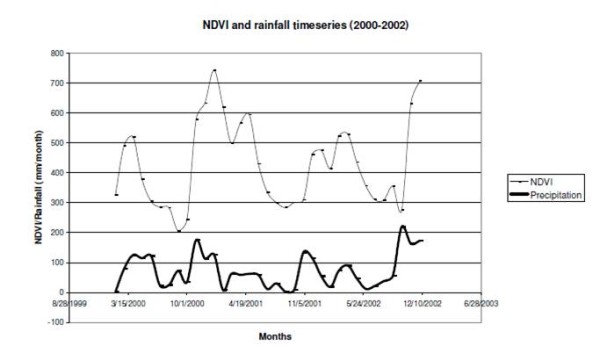
Comparison of NDVI and precipitation time series of one selected location (4.4°S 38.4°E). NDVI values are unitless and indicated with a thin line. The thick line represents the precipitation values in mm/month.

Comparison of NDVI and precipitation time series of one selected location (4.4°S 38.4°E). NDVI values are unitless and indicated with a thin line. The thick line represents the precipitation values in mm/month.