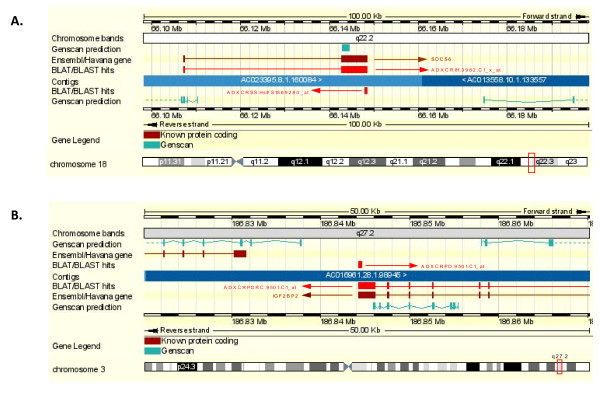
Figure 3.
Genomic alignments. Genomic alignments for two of the SAS pairs represented on the Colorectal DSA and passing detection filtering in the 5-FU sensitive experiment. Sequences aligning to the sense strand of the genome appear in the upper half of the images while sequences aligning to the antisense strand of the genome appear in the lower half. A. Alignment of the DSA sequences corresponding to the SOCS6 gene. B. Alignment of the DSA sequences corresponding to the IGF2BP2 gene.

