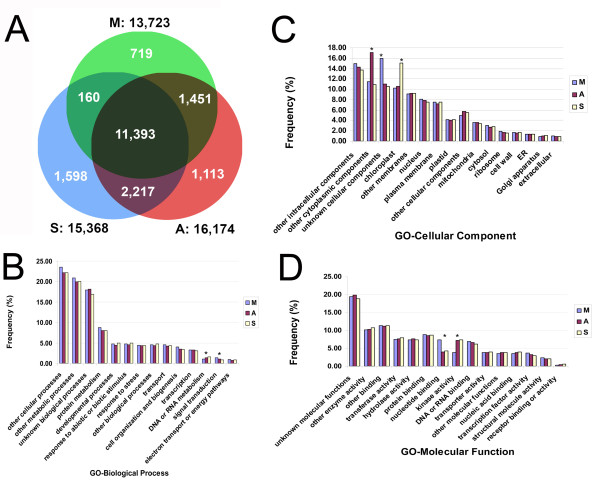
Figure 2.
Distribution of expressed mRNAs among gene function categories. A. Venn diagram of overall gene expression in meiocytes, anthers, and seedlings. B. GO-Biological Process: Distribution and comparison of expressed and annotated genes in meiocytes, anthers and seedlings, the significantly over- or underrepresented gene populations in DNA or RNA metabolism and signal transduction are marked with stars (*). C. GO-Cellular Components: Distribution and comparison of expressed and annotated genes in meiocytes, anthers and seedlings, the significantly over- or underrepresented genes among tissues are marked with stars (*) in unknown cellular components, other cytoplasmic components, and chloroplast. D. GO-Molecular Function: Distribution and comparison of expressed and annotated genes in meiocytes, anthers and seedlings, the significantly over- or underrepresented gene populations in nucleotide binding and kinase activity are marked with stars (*). S = seedling, A = anther, M = meiocyte.

