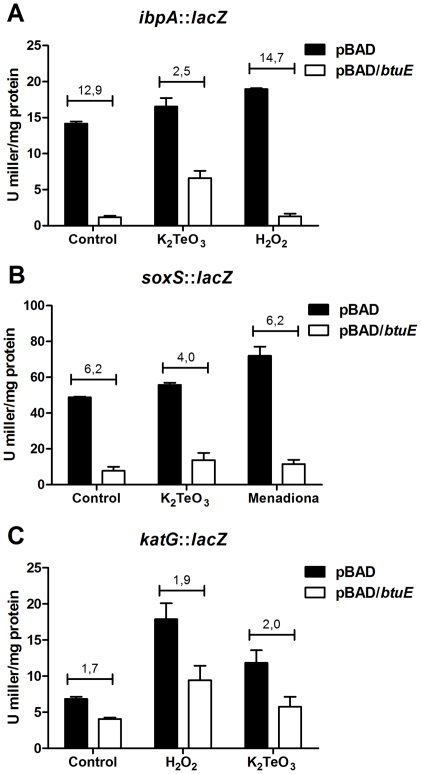
Figure 1. Effect of btuE expression on the transcriptional level of ibpA, soxS, and katG.
β-galactosidase activity was assayed as described [39] in E. coli ADA110 (ibpA::lacZ) (A), SP11 (soxS::lacZ) (B), and GS022 (katG::lacZ) (C) strains carrying pBAD or pBAD/btuE. Data are normalized to the concentration of protein. Cells were exposed for 3 h (ADA110), 30 min (SP11) or 25 min (GS022) in the absence (control) or presence of K2TeO3 (0.5 µg/ml), menadione (100 µM) or H2O2 (100 µM). Assays were carried out in the presence of 0.2% L-arabinose. Values represent the average of three independent trials ± SD. Numbers above each condition represent the pBAD/pBAD/btuE ratio.

