
Figure 5.
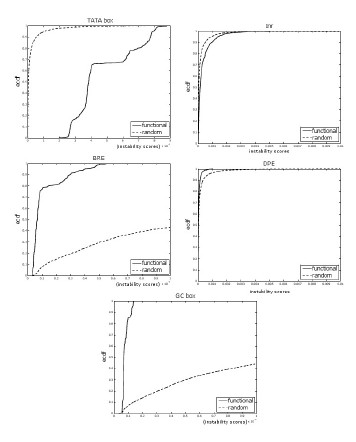
Functional TFBS vs. random sites. The empirical cumulative distribution functions of functional binding sites vs. random sites for the TATA box, Inr, BRE, DPE, and GC box. All with p-value <2.2 10-16. The bubble size is k = 4.
Official websites use .gov
A
.gov website belongs to an official
government organization in the United States.
Secure .gov websites use HTTPS
A lock (
) or https:// means you've safely
connected to the .gov website. Share sensitive
information only on official, secure websites.
Functional TFBS vs. random sites. The empirical cumulative distribution functions of functional binding sites vs. random sites for the TATA box, Inr, BRE, DPE, and GC box. All with p-value <2.2 10-16. The bubble size is k = 4.