Figure 7.

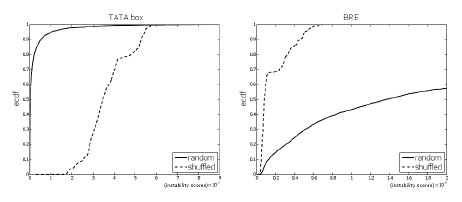
Shuffled motif sites vs. random sites. The empirical cumulative distribution functions of shuffled-motif sites vs. random sites for the TATA box (p <2.2 10-16) and BRE (p <2.2 10-16). The bubble size is k = 4.

Shuffled motif sites vs. random sites. The empirical cumulative distribution functions of shuffled-motif sites vs. random sites for the TATA box (p <2.2 10-16) and BRE (p <2.2 10-16). The bubble size is k = 4.