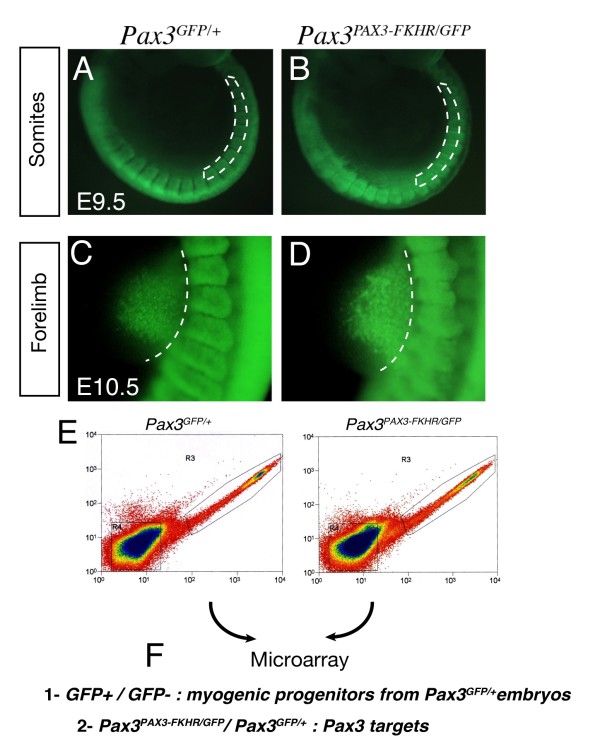
Figure 1.
Strategy of the screen for Pax3 targets. (A-D) Embryos viewed under a fluorescence microscope from Pax3GFP/+ (A, C) and Pax3PAX3-FKHR/GFP (B, D) mouse lines at E9.5, focussing on the interlimb somites (A, C) and at E10.5 focussing on the forelimb bud (B, D). Dotted lines indicate the region dissected. (E) Isolation of GFP positive cells by flow cytometry from the two genotypes indicated, shown for material from E10.5 forelimb buds. The region R3, outlined in E, was used for transcriptome analysis of GFP positive cells. GFP negative cells were obtained from the R4 window shown in (E). (F) Microarrays were performed on RNA isolated from cells of interlimb somites and forelimb buds (A-D) with the genotypes indicated. The comparisons gave information about sequences that mark Pax3 positive myogenic progenitors (1) and that are candidate Pax3 targets (2).

