
Figure 3.
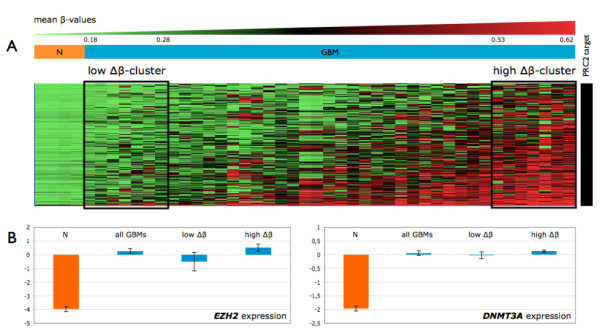
Analysis of the hypermethylated CpGs located within PRC2-targeted promoters. (A) Heatmap of the hypermethylated CpGs located within PRC2-targeted promoters. Samples are ranked horizontally as a function of their mean β-values. Two clusters representing extreme methylation changes (Δβ) relative to control samples (N) are framed. (B) EZH2 and DNMT3A expression level in control samples, GBM samples, the low- and the high-Δβ clusters. The expression values presented are normalized and log-transformed intensities.