Figure 1.
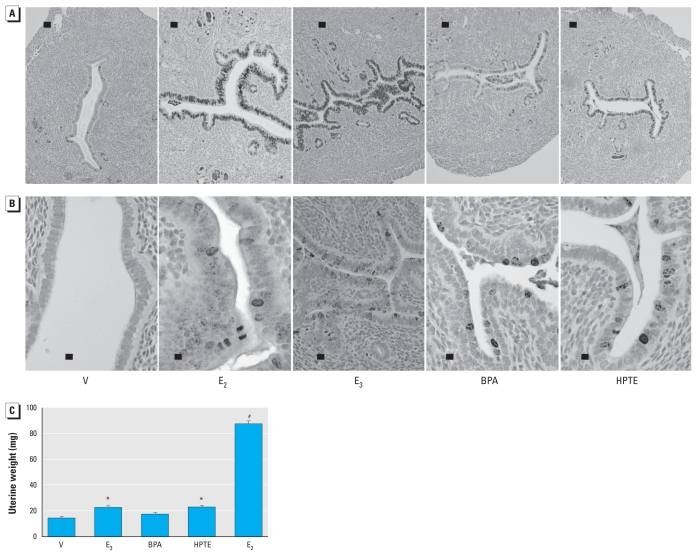
E2-, E3-, BPA-, and HPTE-mediated uterine growth responses. Photomicrographs showing Ki67 (A; bar = 100 μm) and phospho ser10 histone H3 (B; bar = 20 μm) in uterine tissue from mice treated 24 hr with oil vehicle (V), E2, E3, BPA, or HPTE. (C) Uterine weight (mean ± SD) of mice injected daily for 3 days with vehicle, E2, E3, BPA, or HPTE; uterine weights were collected on the fourth day.
*p < 0.05, and #p < 0.001, compared with vehicle, by one-way ANOVA and Tukey’s comparison; all treatment groups were significantly different (p < 0.001) from E2.

