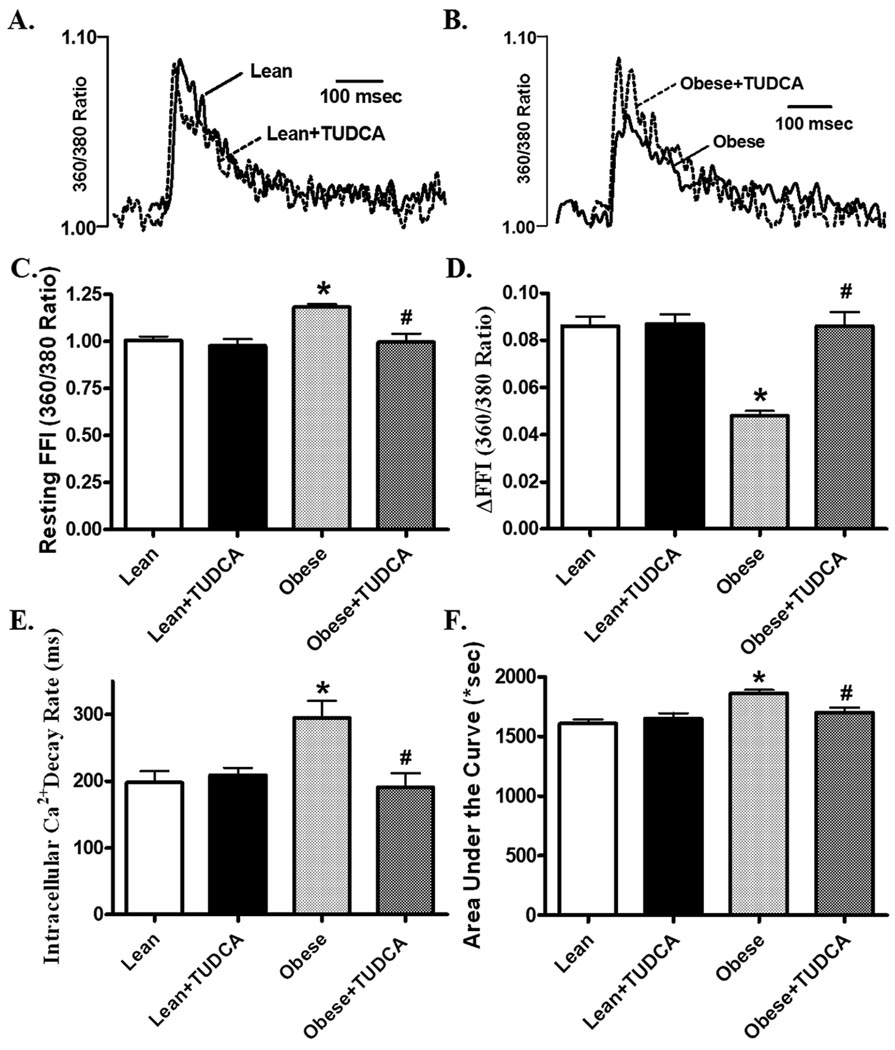
Fig. 3.
Intracellular Ca2+ properties of cardiomyocytes from lean and ob/ob obese mice treated with or without TUDCA (50 mg/kg for 5 wks, p.o.). A: Representative intracellular Ca2+ transients from lean group with or without TUDCA treatment; B: Representative intracellular Ca2+ transients from obese group with or without TUDCA treatment; C: Resting fura-2 fluorescence intensity (FFI) representing basal intracellular Ca2+ levels; D: Change of intracellular Ca2+ in response to electrical stimuli (ΔFFI); E: Intracellular Ca2+ transient decay rate; and F: Area underneath the curve of intracellular Ca2+ transients. Mean ± SEM, n = 60 – 61 cells from 3 mice per group, * p < 0.05 vs. lean group, # p < 0.05 vs. obese group.

