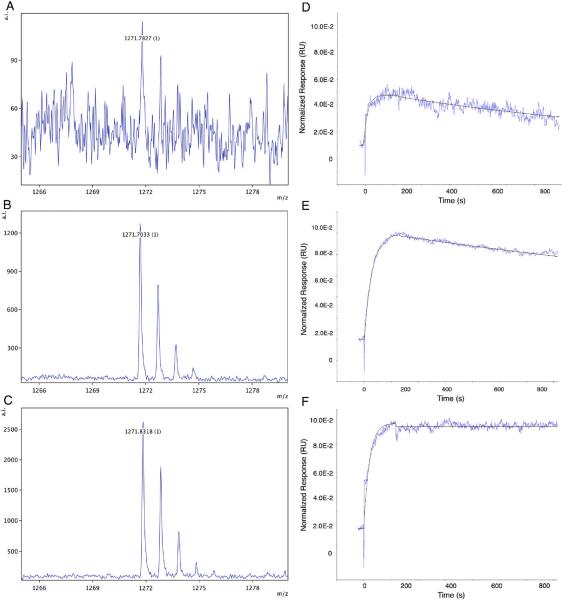
Figure 3.
Peptide enrichment by MiSCREEN and surface plasmon resonance plots of low, medium and high affinity RabMAbs. Selected RabMAbs specific for the same peptide and having low (Panel A) medium (Panel B) and high (Panel C) affinities were compared using MiSCREEN assays for their ability to bind peptides from solution. On the left hand side of the figure are shown single replicate spectra representing binding of peptide CPTAC-39d (1271.71 Daltons; a proteotypic surrogate of thyroglobulin) by RabMAbs in different hybridoma supernatants as tested by MiSCREEN. Panel A: RabMAb 35-25; Panel B: RabMAb 35–36; Panel C: RabMAb 35–41. Note the differences in peak intensities shown on the right hand vertical axes. On the right hand side of the figure are shown the corresponding SPR peptide binding and dissociation curves for the same antibodies. The half off-times of these antibodies were: Panel D: 8 minutes, Panel E: 22 min and Panel F: 174 min, respectively.

