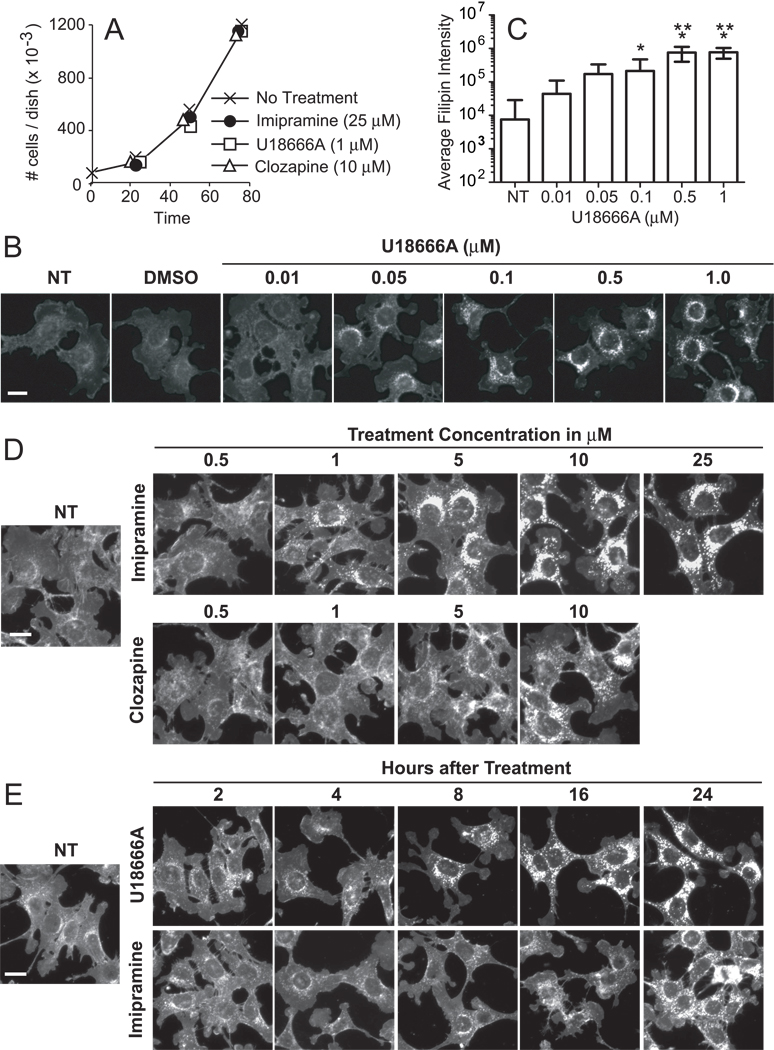
Figure 1.
Effects of U18666A, imipramine and clozapine on 1c1c7 cell growth and filipin staining. (A) Cultures of murine hepatoma 1c1c7 cells were treated with the indicated concentrations of U18666A, imipramine, or clozapine before being harvested and counted. Data represent means ± SD of three plates per treatment per time period. Similar results were obtained in a second independent experiment. (B) 1c1c7 cultures were treated with nothing (NT), DMSO or indicated concentrations of U18666A for ~24 h before being processed for filipin staining. (C) Quantification of per cell filipin fluorescence intensity in 1c1c7 cultures treated with U18666A for ~24 h. Data are from the experiment depicted in panel B and represent means ± SD of analyses of 18–35 cells for each treatment group. *Significantly greater than non-treated (NT) control, P<0.05. **Significantly greater than 0.1 µM U18666A treatment group, P<0.05. (D) 1c1c7 cultures were treated with nothing or indicated concentrations of imipramine or clozapine for ~24 h before being stained with filipin. Similar patterns were observed in two additional experiments. (E) 1c1c7 cultures were treated with nothing or 1 µM U18666A or 25 µM imipramine for different lengths of time before being processed for filipin staining. White bar in panels B–E represents 20 microns.

