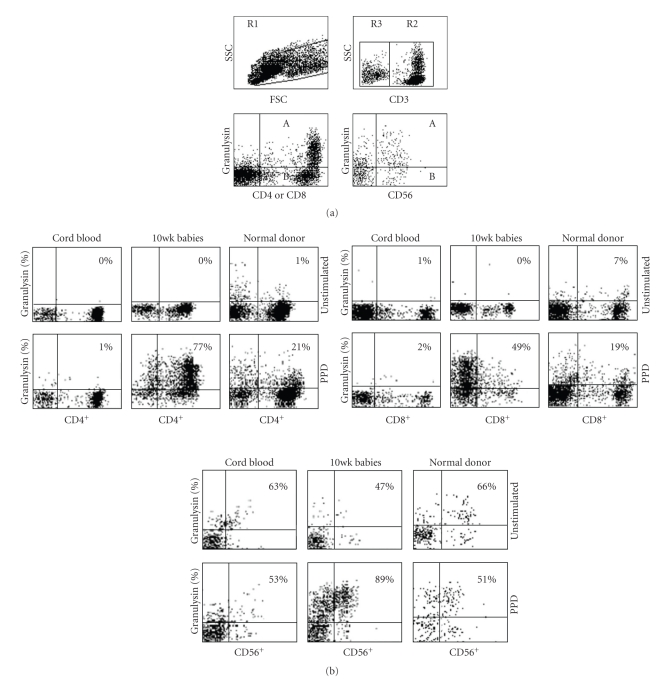
Figure 1.
(a) Flow cytometric diagram illustrating the gating strategy for the expression of granulysin (or Perforin) in T-cells and NK cells. R1 represents a general lymphocyte gate including all lymphocytes in a PPD stimulated PBMC sample. R2 incorporates all CD3+ T-cells within the R1 gate, and R3 includes all cells that are CD3−. Percentage cells expressing granulysin (represented on the y-axis) are evaluated by dividing the number of cells in A by the number of cells in A + B × 100. (b) Flow cytometric dotplots of granulysin in unstimulated or PPD-stimulated representative samples of cord blood mononuclear cells in the left column, 10-week-old infants after BCG vaccination in the middle column, and PBMC from healthy PPD+ adult volunteers in the right column. Results shown represent T-lymphocytes which are CD4+/CD3+ or CD8+/CD3+ or NK cells which are CD56+/CD3−. See Section 2 for details.

