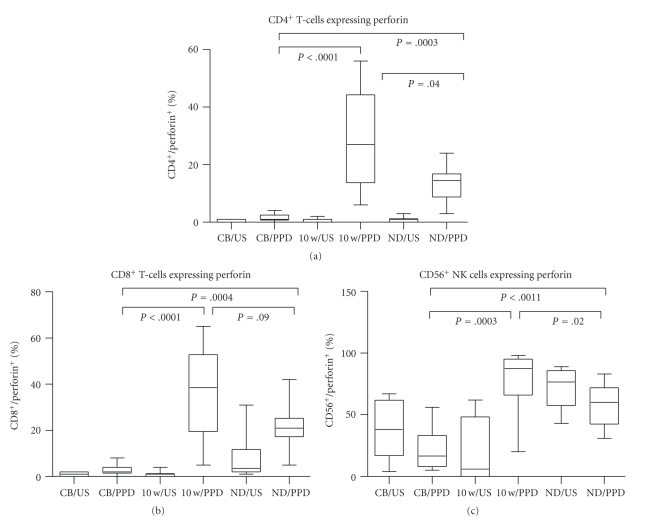
Figure 3.
Perforin expression in CD4+ (a) and CD8+ (b) T-cells and CD56+ (c) NK cells in unstimulated (US) and PPD-stimulated mononuclear cells isolated from cord blood (CB, n = 10) or peripheral blood from BCG-vaccinated infants (10 w, n = 45) or healthy PPD+ adult volunteers (ND, n = 10). Significance is shown as PPD stimulation in CB compared to 10-week-old infants and healthy adult controls, and 10-week-old compared to healthy adult controls. The box extends from the 25th to 75th percentile, the line represents the median, and the whiskers represent the maximum and minimum values.

