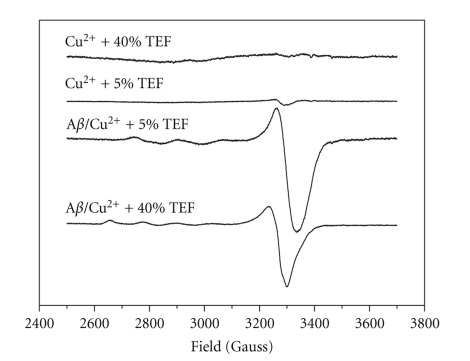
Figure 3.
EPR spectra for Cu2+ only, Aβ40/Cu2+ in either 5% or 40% TFE. The characteristic g∥ and g⊥ hyperfine peaks appeared in 5% and 40% TFE represent that copper ion coordinates with Aβ40 in a 3N1O mode. The characteristic bands in 40% TFE are slightly shift downfield compared with the hyperfine peaks appeared in 5% TFE, suggesting that Aβ40 adopts different conformation in 5% and 40% TFE.

