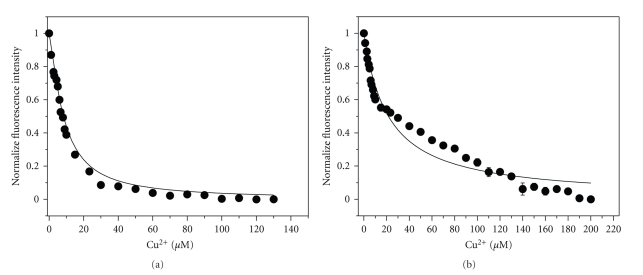
Figure 4.
The binding affinity of Cu2+ to Aβ40 peptide in (a) 5% TFE and (b) 40% TFE measured by tyrosine fluorescence spectroscopy. Insets in (a) and (b) show the Jot plot. The concentration of Aβ40 was 10 μM. The solid lines represent the fitting curve using the equation as depicted in Section 2 with n = 1. The R2 values in (a) and (b) are all >0.96, and the χ2 values are <0.05.

