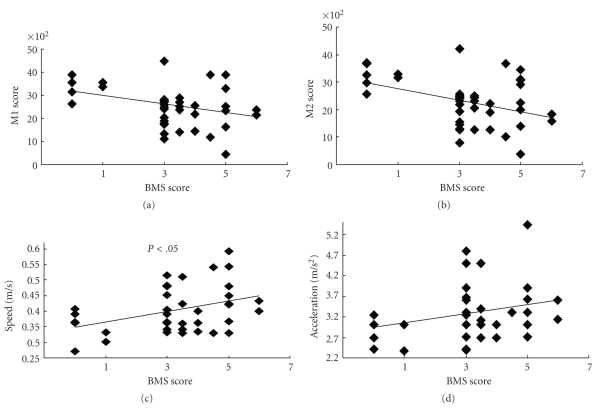
Figure 4.
Correlation diagrams of parameters. M1 and M2 scores had minus correlations with the BMS score, while the speed and acceleration showed a strong correlation. Coefficients of correlation are −0.84 for M1 and BMS, −0.83 for M2 and BMS, 0.75 for speed and BMS, and 0.77 for acceleration and BMS.

