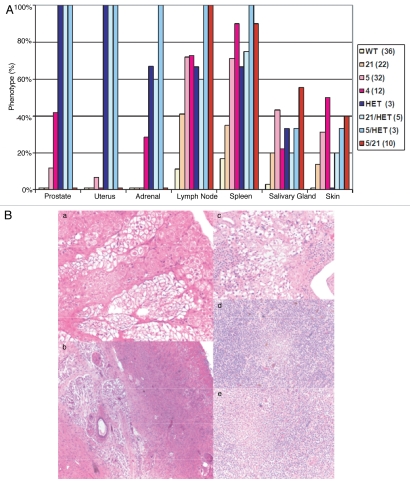
Figure 3.
Pathological phenotype in organs of individual mice lines. (A) Incidence of pathological alteration in organs of individual mice lines. The percentile in the Y-axis represents the proportion of animals in a certain mouse line with pathological phenotype in organs indicated in the X-axis. Each column represents an organ type of an individual mouse line, which was distinguished by fill-in colors as illustrated on the right side of the graph lines (wildtype, WT; PtenshRNA4, 4; PtenshRNA5, 5; PtenshRNA21, 21; Pten+/−, HET; Pten+/−/shRNA21, 21/HET; Pten+/−/shRNA5, 5/HET; Pten+/−/shRNA5/21, 5/21). Numbers in the () indicates the total number of animals analyzed in each line. (B) Histopathology of phenotypes in skin (a and b), salivary gland (c), lymph node (d) and spleen (e) of PtenshRNA mice.

