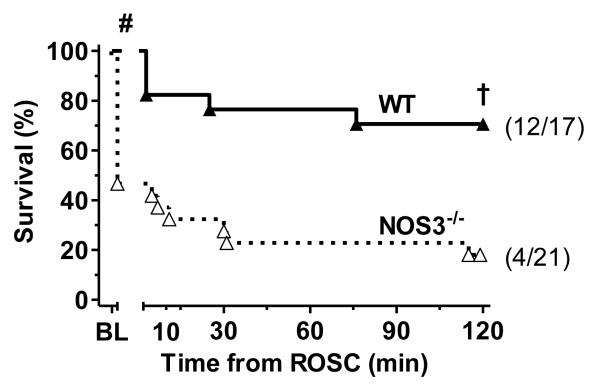
Figure 1.
Kaplan-Meier plot of WT and NOS3-/- strain 120 min survival following cardiac arrest and resuscitation. # p<0.05 ROSC rate vs. WT (Fisher’s exact test). † p<0.05 vs. WT (Mantel-Cox log-rank). Survival in the subset of NOS3-/- animals achieving ROSC (data not shown) was also significantly lower than WT (p<0.05, Mantel-Cox log-rank).

