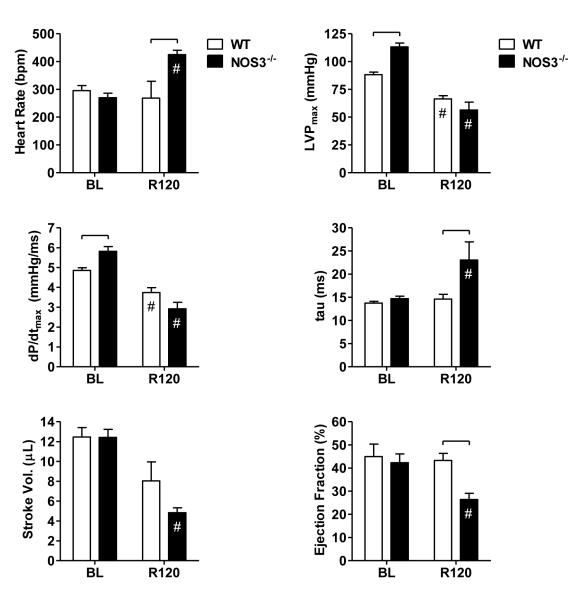
Figure 2.
Left-ventricular pressure-volume indices at baseline (BL) and 120 min following ROSC (R120), including heart rate (HR), peak left-ventricular pressure (LVPmax), maximum rate of pressure change (dP/dtmax), isovolumic relaxation time constant (τ), stroke volume (SV), and ejection fraction (EF). Significant differences between strain groups (brackets,  ) or relative to BL (#) are indicated (p<0.05, two-way ANOVA).

