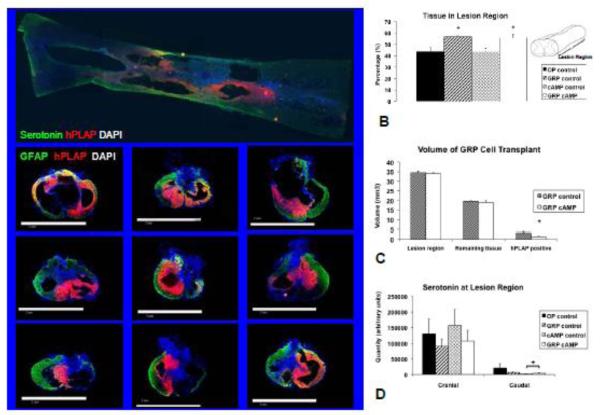
Figure 1.
Lesion region analysis. In A the top panel shows a horizontal section through the lesion in which the extent of the hPLAP positive transplant can be seen; cranial to the left. The bottom panel shows representative images of 9 of the 10 animals that received GRP cell transplants are shown. Sections are 20 μm thick and stained for serotonin (top panel; green), astrocytes (bottom panel; GFAP = green), GRP cells (hPLAP = red), and cell nuclei (DAPI = blue). In B the area of GFAP positive tissue in the lesion region shown as a percentage relative to the cranial and caudal cord and in C the lesion region and transplant volumes are shown determined from transverse sections. The bars to the left show the expected volumes should there be no tissue loss, the bars in the middle show the volumes of tissue remaining, and the bars to the right show the volumes of the GRP transplants for both groups. D shows quantification of serotonin cranial and caudal to the lesion center.
✦: significantly different from OP control and cAMP control (B); significantly different from hPLAP positive volume in GRP control (C); percentage reduction significantly different from OP control (D).

