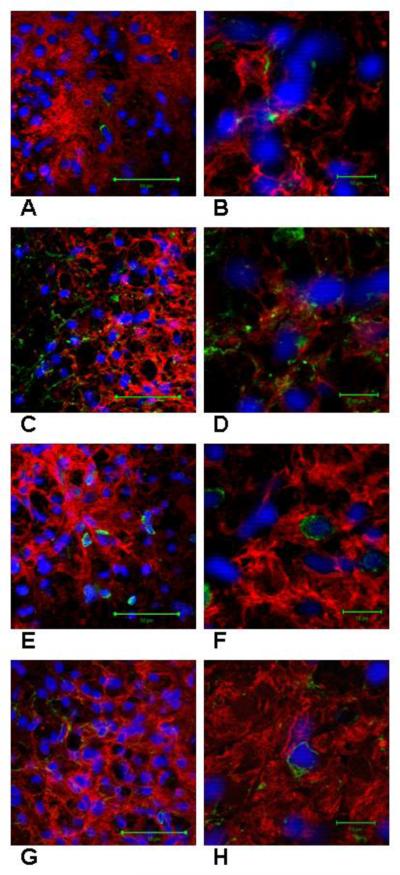
Figure 3.
Differentiation of hPLAP positive GRP cells. Each confocal image (A-H) represents one optical slice from a 20 μm section. In A and B GRP cells are shown that express both hPLAP (red) and nestin (green). In C and D GRP cells are shown that express both hPLAP (red) and GFAP (green). In E and F GRP cells are shown that express both hPLAP (red) and CC-1 (green). In G and H GRP cells are shown that express both hPLAP (red) and NG2 (green). Cell nuclei are stained with DAPI (blue). Scale bar in A, C, E, and G = 50μm and B, D, F, and H = 10μm.

