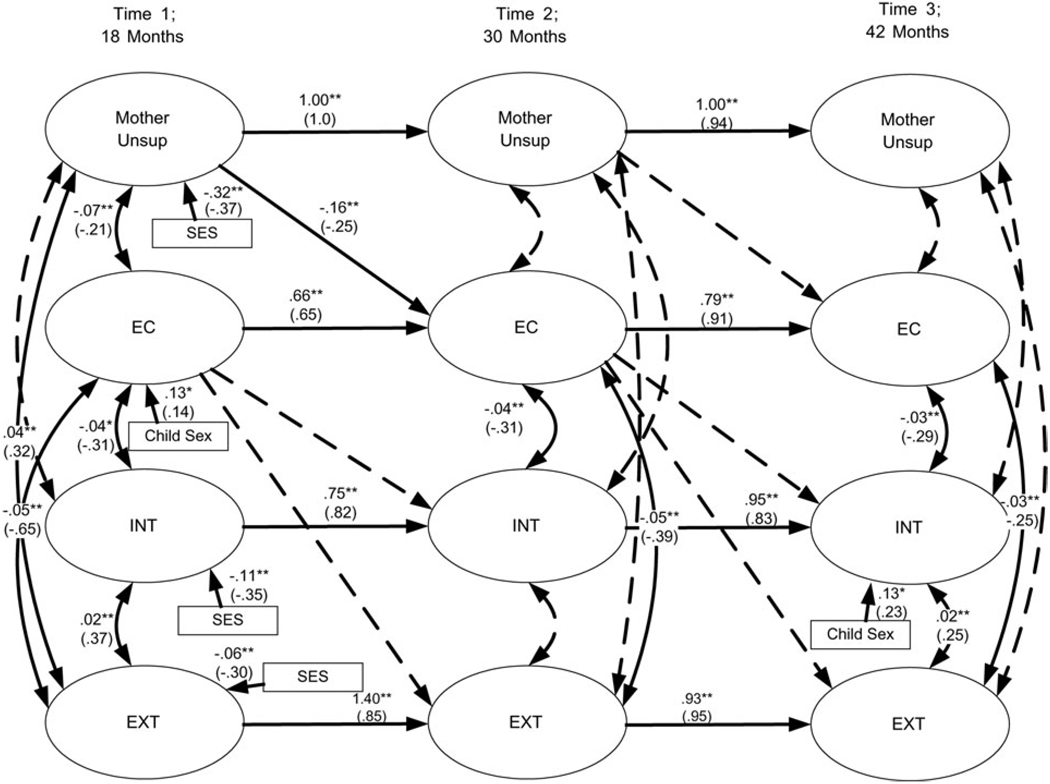
Figure 2.
The cascade model (Model 2). Mother Unsup, mothers’ unsupportive reactions; EC, effortful control; INT, internalizing problems; EXT, externalizing problems; SES, socioeconomic status. Dashed lines indicate tested but not significant paths. Numbers are only present when paths/correlations are significant. The top numbers are unstandardized estimates, and the numbers in parentheses are standardized estimates. Child sex is coded 1 = male and 2 = female; χ2 (483; n = 265) = 717.15, p < .01, comparative fit index = 0.93, root mean square error of approximation = 0.04 (90% confidence interval = 0.04–0.05). *p < .05. **p < .01.

