
Figure 3.
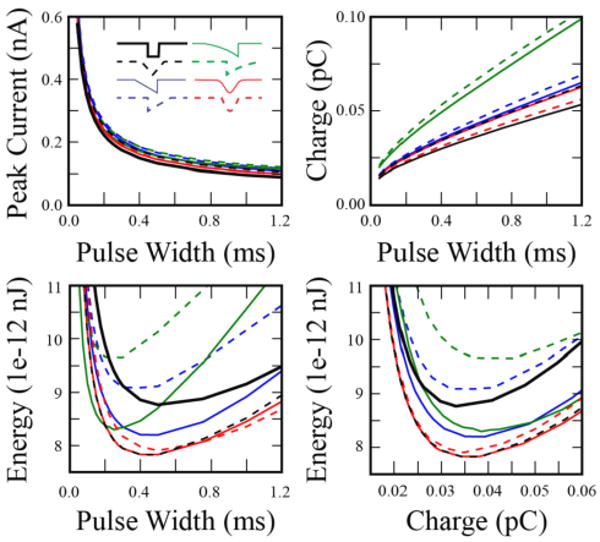
Comparison of charge and energy required to intracellularly activate a single myelinated axon. Current was injected into the central node of Ranvier via a simulated current clamp using 8 different waveforms (inset). Upper left: Strength-duration curve. Upper Right: Charge required for activation. Lower left: Energy required for activation. Lower right: Energy versus charge thresholds. Gaussian and centered triangular waveforms demonstrate minimal energy thresholds, and have significant overlap.