
Figure 1.
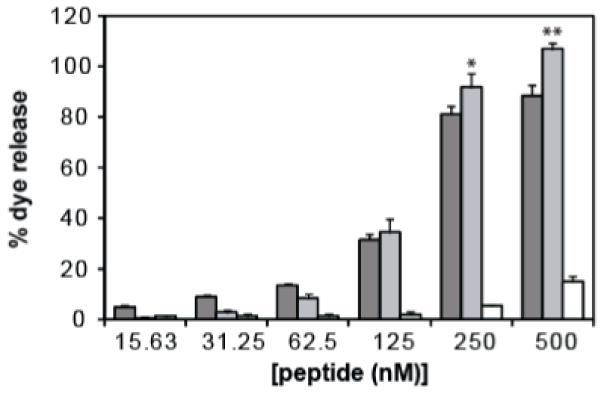
Lytic activity of HGP (dark grey bars), sHGP (light grey bars), and scrHGP (white bars) were measured by the dequenching of a fluorescent dye upon release from liposomes. 0% dye release corresponds to the fluorescence level of untreated liposome solution and 100% dye release corresponds to the fluorescence level after treatment with Triton X-100. Results are reported as mean percent dye release ± SD of triplicate samples. (Student’s t-test, *p<0.05, **p<0.001)