
Figure 2.
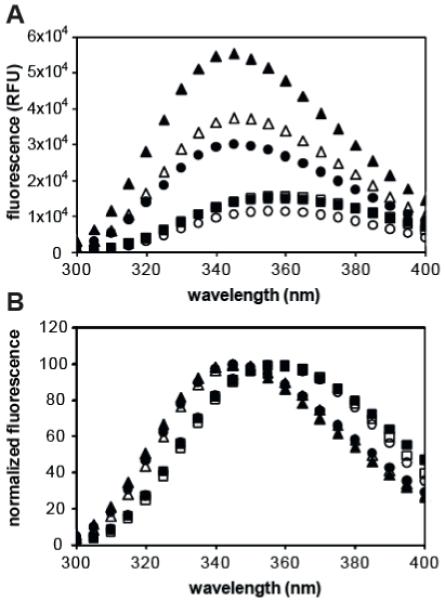
(A) Fluorescence spectra of tryptophan in HGP (circles), sHGP (triangles), and scrHGP (squares) were measured by excitation at 280 nm and reading emission between 300 and 400 nm in 1 nm increments. Fluorescence spectra were taken with (filled) and without (empty) liposome solution. (B) Each fluorescence spectra was normalized by its highest intensity value in order to delineate emission spectra shifts.