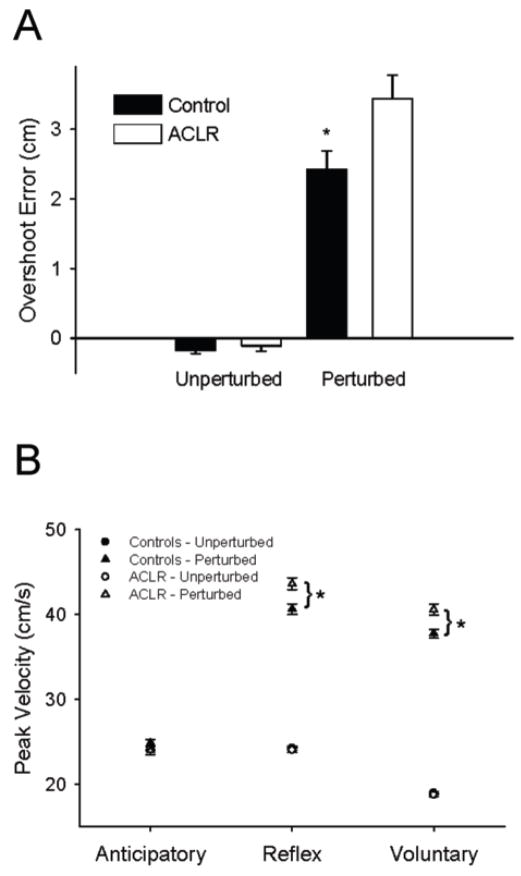
Figure 3.
A) Average overshoot error for the Controls (filled bars) and ACLRs (open bars) during unperturbed and perturbed trials. Values are means ± SE. * represents significant difference from ACLR (p < 0.05). B) Average peak velocity for the Controls (filled symbols) and ACLRs (open symbols) during unperturbed (circles) and perturbed (triangles) trials. Data are represented in 200 ms bins –anticipatory, reflex and voluntary- from the time perturbation occurred (perturbation trials) or would have occurred (unperturbed trials). Values are means ± SE. * represents significant difference between Controls and ACLR (p < 0.05).

