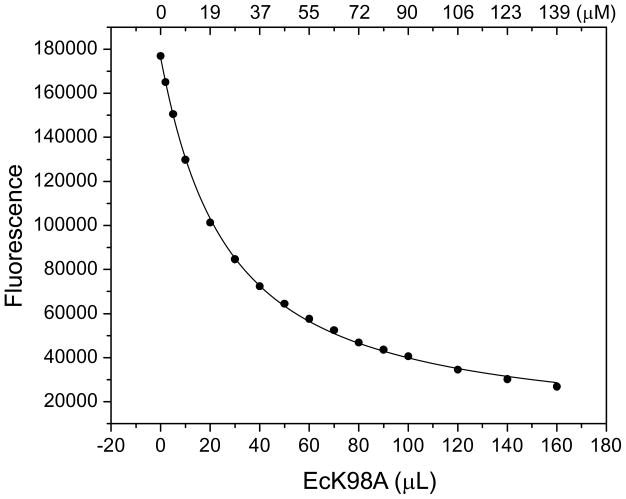
Figure 4. Binding of HPO to EcK98A at equilibrium.
A 2 mL solution containing 5 μM HPO in 100 mM Tris-HCl, pH 8.3, was titrated with EcK98A by adding aliquots of a 1.9 mM EcK98A stock solution at 24 °C. The final HPO concentration was 4.6 μM. The top axis indicates the EcK98A concentrations during the titration. A set of control data was obtained in the absence of HPO and was subtracted from the corresponding data set obtained in the presence of HPO. The solid line was obtained by nonlinear least-squares regression as previously described (14).

