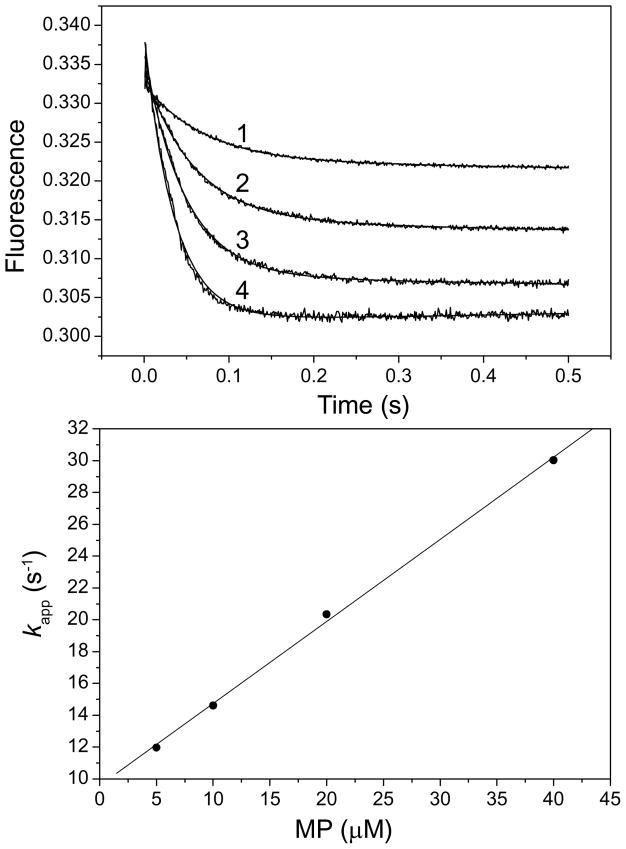
Figure 5. Stopped-flow fluorometric analysis of the binding of HPO to SaE22A.
The concentration of SaE22A was 1 μM, and the concentrations of HPO were 5, 10, 20 and 40 μM for traces 1, 2, 3, and 4, respectively. All concentrations were those immediately after the mixing of the two syringe solutions. Both SaE22A and HPO were dissolved in 100 mM 100 mM Tris-HCl, pH 8.3. The fluorescent signals were rescaled so that they could be fitted into the figure with clarity. The solid lines were obtained by nonlinear regression as described in the Experimental Procedures section. Panel B is a replot of the apparent rate constants vs. the HPO concentrations. The solid line was obtained by linear regression.

