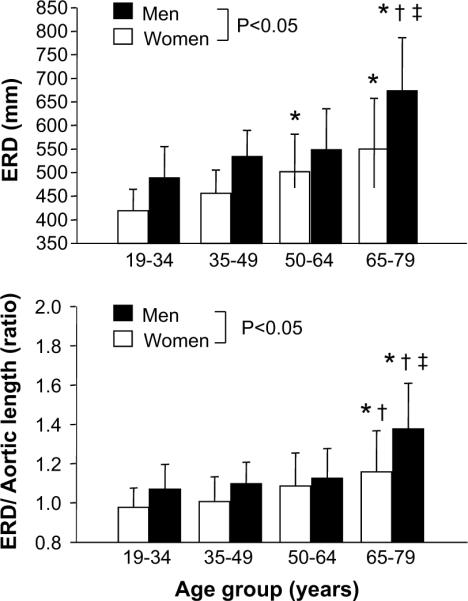
Figure 3.

Aging-related changes in effective reflecting distance (ERD). Open bars show women and closed bars show men. Data are mean and SD. Bottom panel depicts the ERD normalized by the aortic length. Open bars shows women and closed bar shows men. * P<0.05 vs. “19–34” of same sex; † P<0.05 vs. “35–49” of same sex; ‡P<0.05 vs. “50–64” of same sex.
