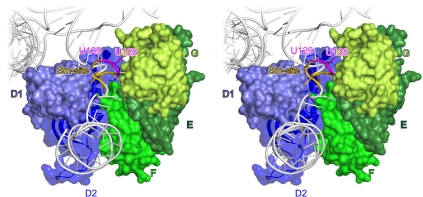
Figure 5.
Sub-core RNP. Stereo plot showing a model of the sub-core RNP after removal of the D3-B sector. Other Sm proteins are labelled and coloured as in Figure 1A. D2 is shown as a ribbon plot, with semitransparent surface highlighting the distal contacts to the snRNA. U1 snRNA is in light grey with the Sm site in gold and residues U128 and U129, presented to D3-B, in magenta. Rotated 120° about the y axis and 45° about the x axis compared with Figure 1A.

